RELIGIOUS AFFILIATIONS, 2011, 2016, AND 2021
|
|
2011 |
2016 |
2021 |
||||
|
|
|
|
|
|
|||
|
Religious Affiliations |
Populations |
Population |
Populations |
Population |
Populations |
Population |
|
|
|
|||||||
|
Christian |
13 149.3 |
61.1 |
12 201.6 |
52.1 |
11 148.8 |
43.9 |
|
|
Catholic |
5 439.3 |
25.3 |
5 291.8 |
22.6 |
5 075.9 |
20.0 |
|
|
Anglican |
3 679.9 |
17.1 |
3 101.2 |
13.3 |
2 496.3 |
9.8 |
|
|
Uniting Church |
1 065.8 |
5.0 |
870.2 |
3.7 |
673.3 |
2.6 |
|
|
Presbyterian and Reformed |
599.5 |
2.8 |
526.7 |
2.3 |
414.9 |
1.6 |
|
|
Eastern Orthodox |
563.1 |
2.6 |
502.8 |
2.1 |
535.5 |
2.1 |
|
|
Other Christian |
1 801.8 |
8.4 |
1 908.9 |
7.7 |
1 952.9 |
7.7 |
|
|
|
|||||||
|
Other Religions |
1 546.3 |
7.2 |
1 920 .8 |
8.2 |
2 538 .6 |
10.0 |
|
|
Islam |
476.3 |
2.2 |
604.2 |
2.6 |
813.4 |
3.2 |
|
|
Buddhism |
529.0 |
2.5 |
563.7 |
2.4 |
615.8 |
2.4 |
|
|
Hinduism |
275.5 |
1.3 |
440.3 |
1.9 |
684.0 |
2.7 |
|
|
Sikhism |
72.3 |
0.3 |
125.9 |
0.5 |
210.4 |
0.8 |
|
|
Judaism |
97.3 |
0.5 |
91.0 |
0.4 |
100.0 |
0.4 |
|
|
Other |
95.9 |
0.4 |
95.7 |
0.4 |
115.0 |
0.5 |
|
|
|
|||||||
|
No Religion(a) |
4 804.6 |
22.3 |
7 040.7 |
30.1 |
9 887.0 |
38.9 |
|
|
|
|||||||
|
Australia(b) |
21 507.7 |
100 |
23 401.9 |
100 |
25 422.8 |
100 |
|
|
|
|||||||
|
(a) No religion includes secular beliefs (e.g. Atheism) and
other spiritual beliefs (e.g. New Age). |
|||||||
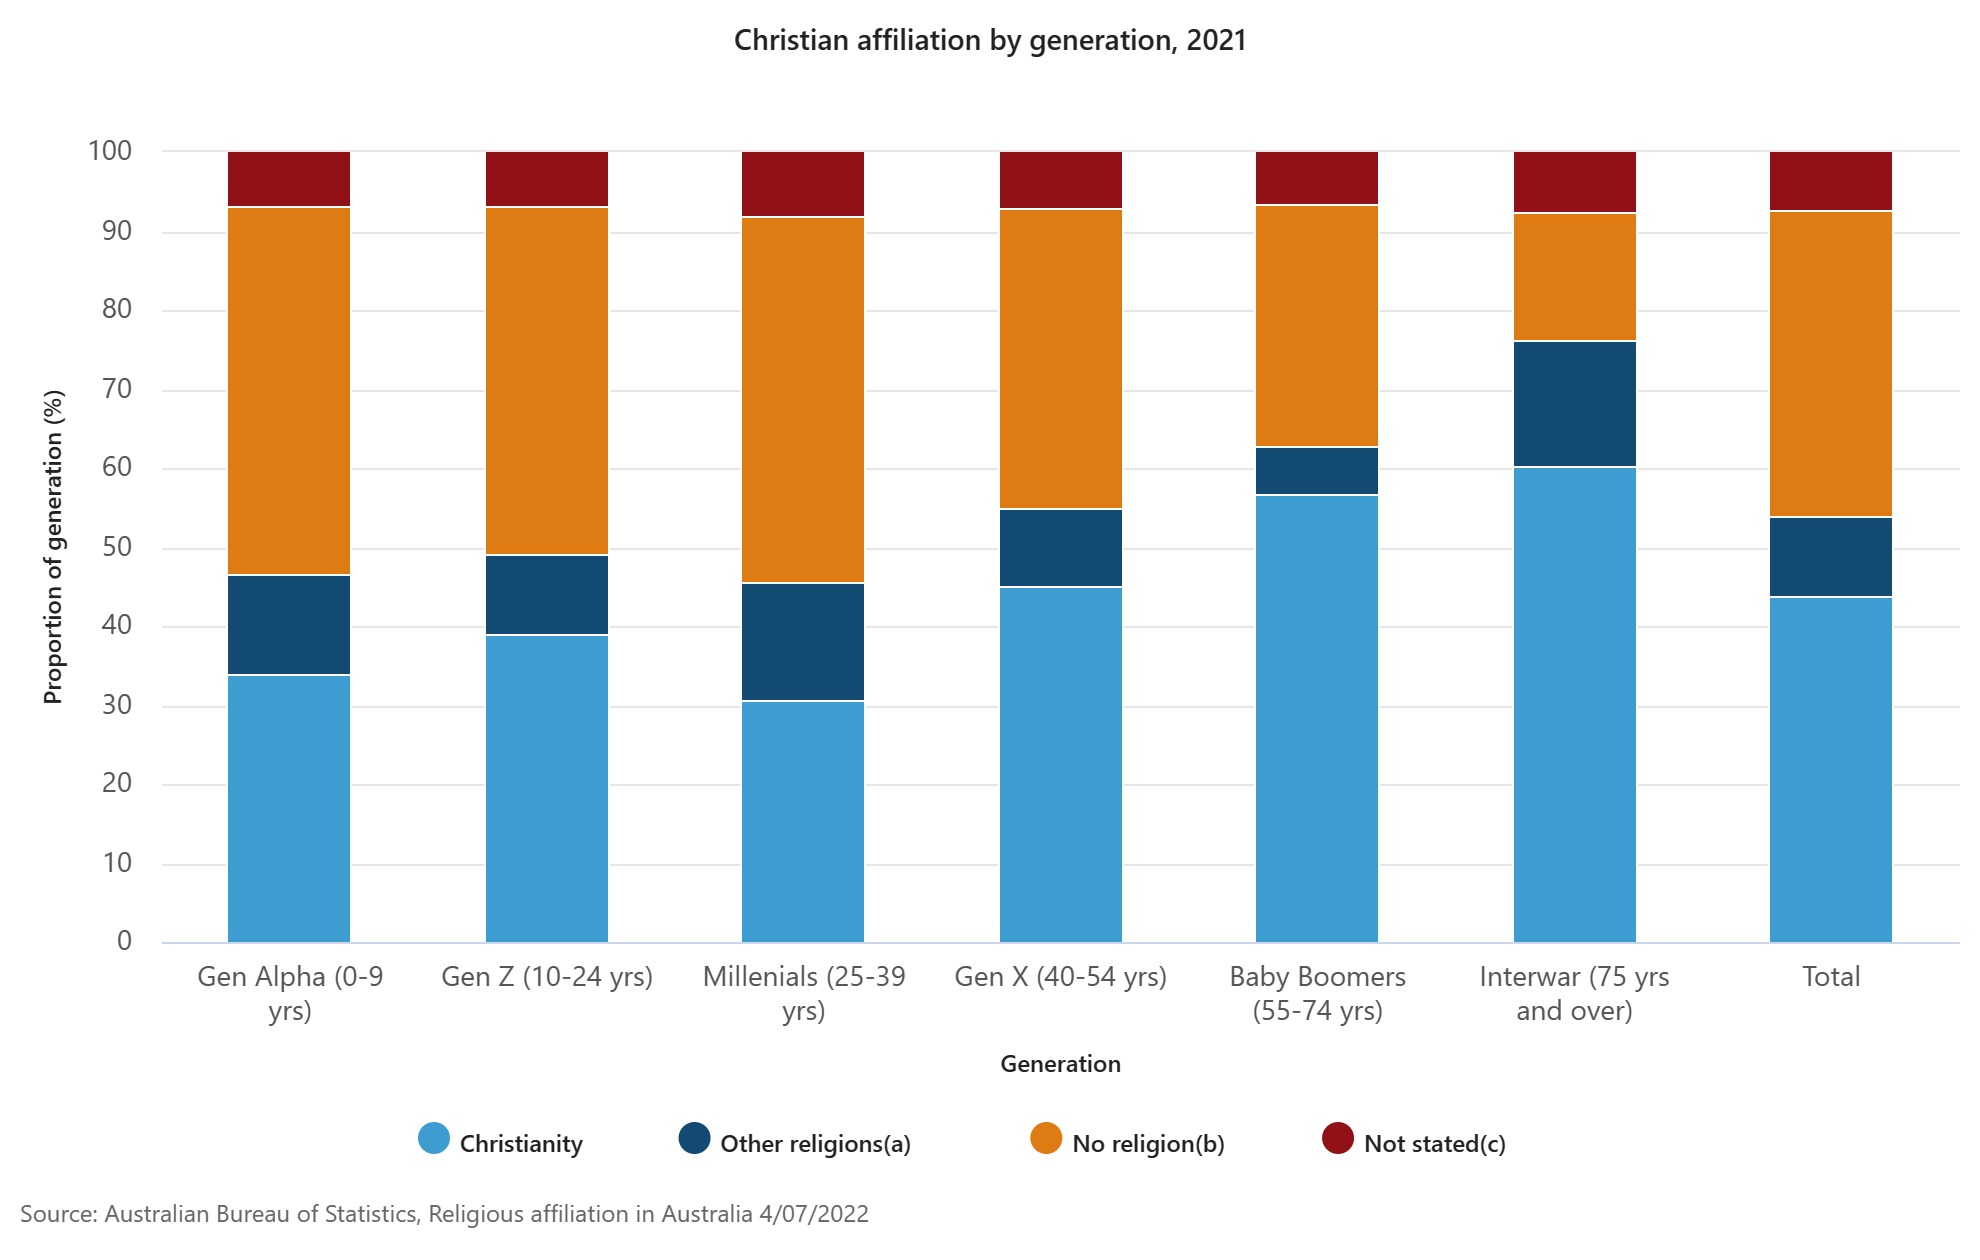
RELIGION AND AGE
Older people, particularly those aged 75 years
and over, were most likely to report Christianity (60%).