|
RELIGIOUS AFFILIATIONS, 2011 AND 2016 |
|||||
|
|
2011(a) |
2016 |
|||
|
|
|
|
|
||
|
Religious Affiliations |
Populations |
Population |
Populations |
Population |
|
|
|
|||||
|
Christian |
13 149.3 |
61.1 |
12 201.6 |
52.1 |
|
|
Catholic |
5 439.3 |
25.3 |
5 291.8 |
22.6 |
|
|
Anglican |
3 679.9 |
17.1 |
3 101.2 |
13.3 |
|
|
Uniting Church |
1 065.8 |
5.0 |
870.2 |
3.7 |
|
|
Presbyterian and Reformed |
599.5 |
2.8 |
526.7 |
2.3 |
|
|
Eastern Orthodox |
563.1 |
2.6 |
502.8 |
2.1 |
|
|
Other Christian |
1 801.8 |
8.4 |
1 908.9 |
8.2 |
|
|
|
|||||
|
Other Religions |
1 546.3 |
7.2 |
1 920 .8 |
8.2 |
|
|
Islam |
476.3 |
2.2 |
604.2 |
2.6 |
|
|
Buddhism |
529.0 |
2.5 |
563.7 |
2.4 |
|
|
Hinduism |
275.5 |
1.3 |
440.3 |
1.9 |
|
|
Sikhism |
72.3 |
0.3 |
125.9 |
0.5 |
|
|
Judaism |
97.3 |
0.5 |
91.0 |
0.4 |
|
|
Other |
95.9 |
0.4 |
95.7 |
0.4 |
|
|
|
|||||
|
No Religion(b) |
4 804.6 |
22.3 |
7 040.7 |
30.1 |
|
|
|
|||||
|
Australia(c) |
21 507.7 |
100 |
23 401.9 |
100 |
|
|
|
|||||
|
(a) 2011 data has been calculated using the 2016 definitions. |
|||||
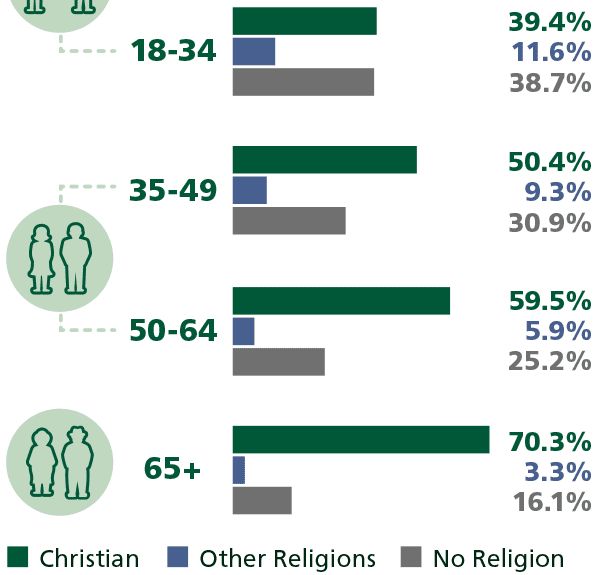
RELIGION AND AGE
Older people, particularly those aged 65 years
and over, were most likely to report Christianity (70%).
RELIGIOUS AFFILIATION AND AGE, 2016