
Opening F-111 dump and burn at Riverfire 2006, an annual fireworks/RAAF spectacular at South Bank in Brisbane, Saturday September 2nd 2006
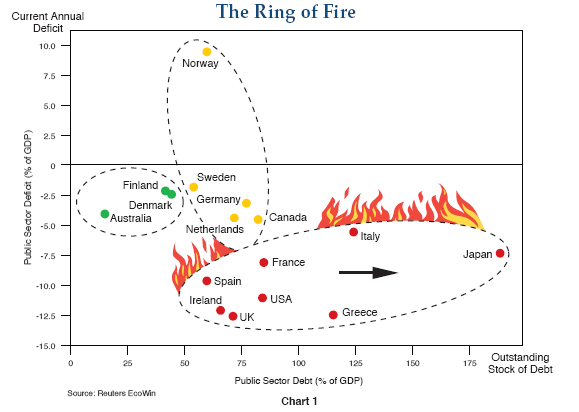
The most vulnerable countries in 2010 are shown in PIMCO’s chart “The Ring of Fire.” These red zone countries are ones with the potential for public debt to exceed 90% of GDP within a few years’ time. The yellow and green areas are considered to be the most conservative and potentially most solvent, with the potential for higher growth.
http://www.pimco.com/EN/Insights/Pages/February 2010 Gross Ring of Fire.aspx archived
On February 11, 2010 12:14 PM, "Stephen Williamson" wrote:
Hi all
Really interesting graph in today's Australian, comparing numerous advanced economies in the western world, in terms of their public debt and budget deficit (as a percentage of GDP).
So, going left to right, it shows Gross Government Debt as a percentage of Gross Domestic Production (for the year). We've jumped from 10% of GDP in 2007 to about 17% (or more) now, and though it's still going up, it's still the lowest of all the countries on that list. That, doubtless, is with major thanks to Costello and Howard.
Going top to bottom, it shows current government surplus / deficit for the year, once again as a percentage of Gross Domestic Product. And, once again, Australia's 4% deficit, though it's in deficit, still looks fairly healthy, compared to, say, poor old Greece .
In fact, we look like we're in a better state than just about any other country on the list.
Click here to read the full article.
As a friend replied: Great graph. We are a blessed nation.
Final amounts:
Govt figures for 2009-2010 showed total tax revenue of $290 billion, and total govt expenses of $338 billion, leaving an operating deficit of $48 billion. Our GDP that year was about a cool $1 trillion.
Govt Salaries 2009-2010 PM: $340,704 Deputy PM: $268,632 Treasurer: $245,700 Opposition Leader: $242,424
Click here for a Euro journal tracking the IMF's bailout of Greece on May 4th 2010.
Brief Quote "The Greek bailout means Euro-area nations are indeed their brothers' keepers, which in practice means every country's debt is on every other country's balance sheet."
Click here to read Wikipedia's article on each country's GDP.
Click here for a "Sweeping Plains" article by KPMG partner, Bernard Salt in "The Australian" on Australia Day 2017.
Click Here for "The Great Southland" by Geoff Bullock © 1991 Word Music Recorded at paulsplace
Update in 2025: While GDP has increased to $AU 2.8 trillion, Gross Debt is now 33% GDP ($900 billion),
Below is a quick definition of GDP Gross Domestic Product. All three approaches are designed to bring a roughly equivalent total.
Note too, the following figures are specifically excluded from GDP:
** With regard to gifts to churches/non-profit aid organizations, click here for the "mutuality" principle that's applied.
Click here for the Australian Govt's Reserve Bank Balance Sheet comparing 2025 with 2024.
Click here for UTS financial lecture notes on how the Reserve Bank actually operates as a clearing house for all Australian banks every day.
From https://s3-ap-southeast-2.amazonaws.com /nexusnotes-media/wp-content/uploads/edd/2016/07/16031534 /Pages-from-The-Financial-System-Notes.pdf
Click here for the timeline of our "Big Four" Australian banks. Includes a link to the latest APRA report showing current assets and liabilities of all Australian banks.
Click here for a 45 year graph estimates 1971 - 2016 of Australian Govt Net Debt (Gross Debt less Financial Assets in Currency, Stocks and Bonds) as published by FlagPost - Australia's Commonwealth Parliamentary Library - in 2012.
Click here for a 60 year Aussie Home Interest Rates Timeline 2019 back to 1959.

Secondly in 1819 & Campbells/NSW Savings Bank, virtually no depositor in Australia who then stayed in Australia has ever lost his or her money in a *savings bank (under trustees and the patronage of the Governor). Currently all deposits up to $AU 250,000 per customer per institution are insured, including approved credit unions.
*note too, until the mid-1960s savings banks and trading banks were treated as separate categories
Looking at the first question, in 1788 it was the grand old days of "promissory" / "small change" exchange notes used for bartering — all having a "face" value and a "buying" value. 100 businesses apparently got started up this way in Sydney and Hobart. Yes, the imagination boggles at what they promised soldiers, administrators and free settlers, both legally and illegally. And with a major shortage of silver coins, rum became the colony's "money", more by necessity than choice.
A brief background: With the departure of Captain Phillip at the end of his tenure as governor in 1792, the infant colony was briefly left in the care of lieutenant-governors who governed on behalf of the New South Wales Army Corps. Importantly, members of this military force had the ability to raise capital — labour and materials — by borrowing against their regimental pay, which was accumulating back home in England.
At the time, John Palmer was the official commissary in Sydney, empowered to draw bills of exchange on the British Treasury countersigned by the governor. He kept the public accounts and funds of the colony and was at once official supplier, contractor and banker to the settlement.
In 1793 the American trading ship, the 'Hope', arrived with 7,500 gallons of rum in her cargo. The other goods she carried were desperately needed but the Hope's captain insisted that he would sell nothing to the colonists unless they also bought all of his rum. The New South Wales Corps officers accordingly formed a syndicate with regimental paymaster John MacArthur fixing the necessary IOUs against the regiment's funds in England, bought this cargo, then distributed it at a sizeable profit. The vast pool of rum flooded into the market place at grossly inflated prices and at once became a means of exchange. For their efforts, the New South Wales Corps were immediately dubbed the 'Rum Corps', a name which stuck until their recall to England in 1810. The rich pickings they made from that first deal gave them the power to monopolise almost all trade, particularly that in rum (the name given to all spirits), for those 17 years.
In 1805 MacArthur, having resigned his commission, was appointed 5,000 acres at Camden Park by the Privy Council in London for his growing herds of Merino sheep, and run from Elizabeth Farm near Parramatta, his original acreage that he had named after his wife.
Click here for further background to John MacArthur, his trips to England, and an account of the coup against Governor Bligh in 1808 which led to MacArthur's son going to London accompanied by the first bale of exported wool.
Click here for an archived history of Australia Post, with Isaac Nichols appointed the first postmaster in 1809. Having one man in charge alleviated the mayhem that at times occurred when supply ships arrived, which was said to include unscrupulous people taking other people's mail and selling it back to them. Nichols worked from his house, also substantial buildings he had built in lower George St then known as High Street from where he had also established a shipyard. The cost to a recipient for the service he provided was one shilling i.e. about $65 today.
Incidentally, this principle of "having the recipient pay" is still practised by Australia Post with letters or parcels where there is no (or under) paid postage. If there is no return address listed on the back, their "stated" policy is to leave a card for the addressee advising of a postal article awaiting with more to pay on it. Then, if still unclaimed and if there is no return address inside, after a length of time — between three and 12 months depending on the value of any goods inside — any goods are auctioned off for charity.
In 1810 Governor Macquarie arrived with a new army regiment, followed in November 1812 by a shipment of £10,000 value in Spanish dollars for the colony's use i.e. $40,000 of Spanish silver coins each one valued at 5 shillings. The centre part of each coin was punched out to render the coins a lower value outside Australia, with the centre part called a "dump" and worth 1s 3d. Called "holey dollars".
In 1817 Bank of NSW trading bank, a signature book, a leather bound ledger book, even passbooks for prominent accounts. All government departments opened accounts. MacArthur returned that same year, with his exported wool soon making him the "richest man" in NSW.
In 1822 the holey dollars and dumps were recalled and replaced with sterling coinage, using silver and copper coins issued to the troops from the London mint. In January 1826 English currency became Australia's official currency. Within 10 years all other coins disappeared from circulation. The holey dollar was demonetised in 1829 with the coins subsequently melted down into silver bullion.
After Federation in 1901, British coins continued in use. In 1910 came the first Australian silver coins, all also minted overseas, threepences, sixpences, shillings and florins, then in 1911 Australian copper pennies.
Not until after WW1 started did Australia's first silver coin minting begin, at the Melbourne mint, in 1916. The Canberra Mint was opened in 1965, in preparation for Australia's decimal coinage.
Back to 1835. The Bank of Australasia (today ANZ) opened in London. It offered emigrants safe transit of funds via a Letter of Advice, with a copy of their signature posted to their appropriate bank branch, awaiting their arrival.
Australian banks were now divided into two distinct categories — savings banks and trading banks. Savings banks paid virtually no interest to their depositors, their lending activities were restricted to providing mortgages, and ended up guaranteed or owned by their colonial governments, using post offices as front counter agencies SA-1848, WA-1864, Vic-1865, Qld-1865, NSW-1871, Tas-1882. Safer for borrowers and depositors. Trading banks on the other hand were private banks, essentially merchant banks, which provided no services to the general public, but were underwriters for farmers, miners, builders, etc. They printed private banknotes / future-dated promissory notes, based on their paid-up capital — starting with that Bank of NSW in 1817. But most of these trading institutions closed their doors — specifically through depressions in the 1840s and in the 1890s — as businesses that partnered with them failed, with inadequate insurance. And then there were the standover merchants, not to mention bushrangers. It was a tough land. Ouch.
But with savings banks, even when fraud occurred, losses were borne via colonial government regulation only by shareholders & overseas depositors / banknote holders. Rarely, if ever, by Australian depositors / banknote holders. While runs on savings banks certainly occurred, it meant a corresponding "domino" effect was short-lived. For example, in 1843 with the Savings Bank of NSW, having no relation to the Bank of NSW, but issuing passbooks from 1832, the colonial government guaranteed trustees' borrowings, if taken out to meet bank's repayments, of up to £50 000.
This action followed the crash, and loss to many wealthy ones, of an early merchant bank known as the
And private banknotes and cheques gained a bad "rap". Click here for further background.
Of course, the gold rush in 1851 helped — some people . A Sydney mint opened in 1855, issuing gold coins, followed by the Melbourne mint in 1872, then Perth in 1899.
In 1862, for a maximum of £20, the NSW Post Office money order service commenced, first under its Treasury, in 1865 its Postmaster-General (PMG). Money orders could be sent to the colonies, and London.
In 1893, the year of the great Brisbane flood and with many banks failing, the Queensland Treasury issued their own legal tender banknotes, and prohibited all private banks in its colony from issuing their own notes. These, instead, replaced the private banknotes of the eight trading banks whose doors had not closed.
Click here to read about the political situation, with missionaries from London requesting Queensland's protection to New Guinea in the immediate north.
But back to banking, they were the first colonial government to issue notes on a major scale since, perhaps, the days of that regimental paymaster John MacArthur in 1793 with those IOUs. And, as intended, it helped restore confidence and brought people and investment — to Brisbane (and Queensland).
Queensland had another "first" 84 years later when under Joh Bjelke-Petersen it
Income Tax and Pensions (via GPO Cash payment, Cheque option after WW2, Direct Deposit 1984)
Back to Banknotes in 1910 the Commonwealth Treasury said it would give the same banknote guarantee, Australia-wide, and told the Queensland Treasury to stoppit . They purchased all unused private banknote paper, once again, provided that doors were still open, overprinted them with the words "Australian Note", securing them with gold, and making them payable in gold coin at the new Melbourne Treasury, on demand. Telegraphic Transfers between banks, and London, steadily grew in importance.
In December 1911 the Commonwealth Bank opened for general business, gradually merging every Post Office bank. A branch opened in Melbourne in July 1912, in Sydney and other capitals in January 1913, with Sydney made its Head Office after 1916.
In 1913, the Australian Treasury began printing brand new banknotes in Melbourne using the company
World War 1 disrupted the operations of the Gold Standard because of the physical difficulties of shipping gold, not to mention the problems involved in financing the war effort. In July 1915, Australia followed the United Kingdom in leaving the Gold Standard. Gold exports except with the Treasurer's consent were prohibited until Australia returned to the Gold Standard, along with the UK, in 1925.
In 1920 the Commonwealth Bank became Australia's Central Bank, and took over responsibility for note printing from the Commonwealth Treasury. It became the Clearing House between the Big Four Banks (1. Bank of NSW -today Westpac-, 2. National Bank, 3. ANZ and 4. Itself) and when required, it was a Lender of Last Resort.
In 1929, the Commonwealth Bank Act provided for the requisitioning of all Australian gold in exchange for Australian notes. Formal action was never insisted upon under this legislation, but it marked the beginning of the end of the holding of gold by banks and the public in Australia. The Bank made gold available to meet domestic industrial demand, but exports were strictly controlled. The Australian pound was devalued against the English pound at different rates from 1929 until December 1931, when the government pegged it at 80% of the English pound.
In June 1932, the Commonwealth Bank Act was amended to allow part of the note reserve to be held in UK pounds sterling, with £UK 10 million of gold shipped overseas from the gold reserve of the Australian Notes Fund.
The outbreak of World War II again called for special Commonwealth gold controls. In 1939 regulations under the Defence Act provided for the acquisition by the Commonwealth Bank of newly won and other gold. After the war these controls were continued in the Banking Act, until they were lifted in 1976.
In 1960, the Reserve Bank of Australia became Australia's Central Bank in the place of the Commonwealth Bank, with each member bank holding Exchange Settlement Accounts. Smaller banks and building societies and credit unions though still had no direct access and could only provide customers with agency cheques via an arrangement with a major bank.
On February 14th 1966, Australia switched over to a decimal currency where 10 shillings became $1.00 and £1 became $2.00.
In 1967 when England devalued the pound sterling in relation to the US dollar, the Australian dollar retained its prior value
On August 15 1971 when the US abandoned its $35 per ounce fixed price gold standard and allowed it to officially drop in value, by government policy (and Reserve Bank trading) the Australian dollar rose in value against the US dollar. In September 1974 it became pegged to a "trade weighted index" or a fixed "basket" of currencies.
In 1983 the Australian government fully "floated" the Australian dollar, allowing it to also officially drop in value. Today it no longer fixes its value by reference to any specific currency, or basket of currencies. In 1985 there was massive deregulation. That year sixteen foreign banks gained access to the system, followed by many more. In early 1997, the Reserve Bank increased its holding of overseas currencies, selling 167 tonnes of gold and exchanging it for $US, and later on € euro, and others.
It has enabled it to intervene, e.g. during the global financial crisis, to restore market liquidity and limit excessive price volatility.
The last bank failure in which Australian depositors lost money (and then only a minimal amount) was that of a trading bank, the Primary Producers Bank of Australia, back in 1931. Since then until today, banks have wound up but, banking sector problems have been resolved, without losses to depositors. As mentioned earlier the Federal Government currently insures and thus guarantees deposits (up to $250,000) per customer per institution click here. In 2025 New Zealand $100,000.
Yes, we are such a young country, hard to understand other countries' situations, and so hard for other countries to understand us. And isn't it amazing at how the Lord has undertaken, so often, during those past 237 years.
Click here for further background of how deposit slips and promissory notes evolved into privately backed banknotes and government backed "legal tender" banknotes, and how the bill of exchange turned into a modern cheque.
Click here for some photos of Australia's early pre-decimal banknotes and coins.
With regard to the following timeline tracking Australia's wages click here to view it as a separate page
| Australia Basic Wage Fair Work Commission Wikipedia Fair Work Australia Youth U16 36.8% 16yrs 47.3% 17yrs 57.8% 18yrs 68.3% 19yrs 82.5% 20yrs 97.7% Adult | US Govt Debt US Treasury |
|---|---|
| 1788 One shilling and sixpence per day | $70 million |
| 1797 During Napoleonic wars UK suspends gold payments until 1821 | |
| 1835 | $33 thousand its lowest ever |
| 1865 Farm Labourer two shillings and sixpence per day Carpenter 10 shillings per day | $2 billion US suspends gold payments following American Civil War. 1862-1879 |
| 1907 Seven shillings per day or £2.2.0 per week Basic Award to support a "man, his wife, and three children" | $2 billion |
| 1914 During WW1 both UK and Australia suspend gold payments until 1925 | |
| 1922 £4.10.0 per week with widespread price rises following the First World War Paper money (i.e. a promise backed by 80 tonnes in gold reserves) had become all the rage following the Australian Notes Act of 1910 enabling banknotes issued via Australian Govt Treasury and cancelling those more fallible banknotes of individual banks | $25 billion, through the enormous expenditure of First World War and the setting up of the League of Nations |
| 1928 £4.9.6 per week | $18 billion |
| 1930 £3.1.1 per week during the Great Depression The 6-day week became a 5½ day (44 hour) week Australia & UK suspend gold payments In 1935 the Printers Union wins one week of paid leave | Drops to $16 billion in 1930 then rapidly increases under Roosevelt's "New Deal" |
| 1938 £4.1.0 per week | $40 billion Fair Labour Standards Act under President Roosevelt establishes a basic wage of 25 cents per hour i.e. $US10 for a 40-hour week. Equivalent to £2.10.0 in Australia, with the US dollar worth 5 shillings. In 1940 and WW2 it rose to 6s.2d. |
| 1946 £5.0.0 per week In 1945 the Annual Holidays Act provides two weeks of paid leave | $250 billion due to WW2, followed by the US setting up United Nations and providing help to West Germany, Japan, South Korea, other economies worldwide |
| 1947 £7.2.0 per week In 1948 the 5-day week introduced | |
| 1950 £8.2.0 per week | With the 1949 devaluation of UK and AU currencies, the US dollar in Australia now had become 8s.11d. |
| 1953 £11.16.0 per week with considerable inflation following the Second World War Between 1951-1955 Qld, NSW and Victoria passed legislation granting 13 weeks long service leave to all employees with 15 years or more service, a benefit unique to Australia | |
| 1960 £13.16.0 per week | $300 billion |
| 1961 £14.8.0 per week In 1963 Commonwealth Industrial Court adopts three weeks paid leave | |
| 1966 $32.80 (£16.8.0) per week In 1966, the AU dollar was launched, worth 10 shillings | |
| 1967 $40 (£20) per week ($1.00 per hour) | |
| 1969 $54 per week In October 1968 the minimum hourly wage was $1.35 | $350 billion |
In 1971, President Nixon cancelled the fixed US dollar to gold exchange rate for central banks since 1934 at US$35 per ounce
Click here for our experience in Australia with Gough Whitlam's "seat of the pants" government Dec 1972 - Nov 1975. Free Universities, Free Medical, wow.
| Australia Basic Wage | US Govt Debt |
|---|---|
| 1972 $80 per week In 1974 four weeks paid leave plus 17½% loading | $450 billion |
| 1976 $102 per week Wages have tripled over 10 years through "stagflation" | $620 billion |
| 1978 $120.80 per week | $770 billion |
| 1980 $134.80 per week
In 1983 the 38 hour week introduced | $1 trillion |
| 1987 $178.24 per week | |
| 1990 $214.49 per week | $3 trillion |
| 1995 $284.45 per week | |
| 1997 $359.40 per week | In 1999 UK issued their first nation-wide basic wage at £3.60 per hour £144 for a 40-hour week (ca $360 in Australia) |
| 2000 $400.40 per week | $6 trillion Federal minimum wage rose from 25 cents per hour in 1938 to $7.25 per hour in 2009 but has not been raised since. That's $US290 per week (and in Australia equivalent to $AU445.00 in 2024). Note too that many states have legislated much higher minimum wages. |
| 2010 $569.90 per week | $13 trillion |
| 2020 $753.80 per week | $27 trillion 2020. $29 trillion 2021. $31 trillion 2022. $34 trillion 2023. |
| 2026 $1004.90 per week plus 12% compulsory superannuation, according to ABC nearly the highest in the world | Just before midnight on Friday 22 March 2024 in Republican dominated US Congress, an approved increase provided funding for key federal agencies including Homeland Security, Justice, State and Treasury, tracking with an agreement in May 2023 that increased the debt ceiling into Jan 2025 so the US government could continue paying its bills. In Mar 2026 it was $39 trillion, $31.4 trillion owned by the US public, US Govt and Federal Reserve, $7.6 trillion in foreign investment. |
Back to Australia. In July 2026 $1004.90 per week, which becomes $200.98 per day, which is 287 times the seven shillings daily wage of 1907.
A fair increase in inflation over these 119 years. At that 287-fold rate of increase and accelerating another 61 times as this was the acceleration factor over the 4.67 increase that occurred between 1788 and 1907, by 2145 we could all be earning over $3½ million per day.
Not bad.
Prior wages in UK: in 1640 (10d daily), in 1583 (8½d), in 1541 (6½d), in 1401 (4d), in 1351 (3d), in 1261 (2d), earlier for perhaps 1,200 years (1d).
Hmm slower. Yes at these times may we keep our eye on the Lord. Let our eye be single, having "dove's eyes".
** End of article
In the Australian newspaper December 8th 2021, it was published that 55 million non-cash payments, worth around $650bn, are made in Australia every day.
Click here for further information on inter-bank payments at the
Click here for further background to the minting of Australian coins from the English Royal Mint.
Click here for Payment Card Identifier prefixes overseen by the American Bankers Association e.g. Visa founded by the Bank of America as Americard in 1958 and Mastercard founded in 1966 as Interbank, a group of US banks in opposition to Visa. Click here for Visa's Card Acceptance Guidelines for Merchants with its now 20,000 partner banks worldwide.
Click here for the Australian Payments Network, responsible for the BSB system, introduced (from the UK) in early 1970s to speed cheque clearance between Australian bank accounts.
Click here re EFTPOS in Australia. Introduced at BP and Westpac in 1984 then the other major banks, with ATMs Australia-wide following, and inside both Woolworths and Coles by 1988. It used Mastercard's "Maestro" debit card service requiring that cleared funds were available and could be affirmed by each cardholder's issuing bank helping shoppers stay in control of their budgeting.
Click here for Paypal, an EFTPOS member but a merchant (not a bank) based in the US. It was created by Peter Thiel and other investors in 1998, and was owned by eBay 2002 - 2014.
Click here for an easy-to-follow image of the numerous steps involved in the processing of electronic card transactions. Click here for the difference between the "card issuer" bank and the "acquirer" bank (merchant bank).
Click here for BPAY for other Australian merchants, a wholly owned subsidiary of Cardlink Services Limited. It is owned equally by the four major Australian banks i.e. Australia and New Zealand Banking Group, Commonwealth Bank, National Australia Bank and Westpac. Launched in 1997, it is of course totally separate to EFTPOS and BSB.
By 2017 Australian cheques had dropped to one-fifth of their 2007 volume, with around 4 cheques written per person in 2017, down from 20 cheques per person in 2007. A significant share of cheque use is related to commercial payments, and financial institution ('bank') cheques in the case of property settlements.
Mishnaic Hebrew Hamon-accumulation,uproar,disquiet Psa 39:6
Based on List by UBS and Credit Suisse published in 2023
plus List of countries by number of households
| Country ▲▼ | Households (millions) | Household Wealth $US (trillions) | Average Wealth $US |
|---|---|---|---|
| US | 132 | 140 | 1,060,000 |
| China | 522 | 84 | 161,000 |
| Japan | 55 | 22 | 400,000 |
| Germany | 40 | 17 | 425,000 |
| UK | 29 | 16 | 550,000 |
| France | 30 | 16 | 533,000 |
| India | 300 | 15 | 50,000 |
| Canada | 15 | 11 | 733,000 |
| Italy | 25 | 11 | 440,000 |
| South Korea | 23 | 10 | 435,000 |
| Australia | 10 | 10 | 1,000,000 |
| Spain | 17 | 8 | 470,000 |
| Taiwan | 9 | 5 | 555,000 |
| Netherlands | 8 | 5 | 625,000 |
| Mexico | 34 | 5 | 147,000 |
| Switzerland | 4 | 5 | 1,250,000 |
| Brazil | 64 | 4 | 62,500 |
| Russia | 56 | 4 | 71,400 |
| *Others (155 countries) | 937 | $66 trillion | 71,200 |
| **Total | 2300 | $454 trillion | 197,000 |
Click here for the IMF report on GDP growth (annual change) by country.
Below are two lists based on the IMF List 2024 of creditor and debtor nations by Net international investment position.
It shows reserve assets, and financial assets of residents (bonds, money market or other account holdings, equity stakes and financial derivatives) that are claims on nonresidents – and financial liabilities of residents to nonresidents.
In 2024 the US assets total $35.89 trillion, and liabilities $62.12 trillion, way ahead of all others.
There is a discrepancy of $11.203 trillion between dollars invested by creditor nations and dollars in debt by debtor nations, thought to be due to the market value of assets, particularly US assets, not reflecting their historical cost or intrinsic value. Also, Secrets.
List One - 33 creditor/investor nations
Totalling $ trillion
List Two - 56 debtor/investee nations
Totalling $ trillion
Regarding Australia's investee status in 7th position, ever since we were first settled we've relied on other countries to invest in us to help us get going. And our public service has always been somewhat top heavy.
See a recent chart below for how much we individually and corporately owe to "managed funds" (in Australia as well as overseas).
Revelation 17:5 And upon her forehead was a name written, MYSTERY, BABYLON THE GREAT, THE MOTHER OF HARLOTS AND ABOMINATIONS (foul stenches) OF THE EARTH.
Click here re the Four Horsemen, Simon the Pharisee, Judas, and Paul's attitude to taking up a collection.
Click here re the History of Money and click here re the History of Inflation.
On May 28, 2014 6:49 PM, "Stephen Williamson" wrote:
Subject: Chatting about mammon - the great "mamma" this morning :-)
Australia's Federal Net debt in bonds is now about $270 billion
Total State and Territory debt in bonds about $230 billion
(Federal and State net debt reached $1 trillion in 2024-25)
Private company debt in bonds about $720 billion
So, bonds investment: $1.22 trillion
Total private housing debt about $870 billion
Total investment housing debt about $410 billion
So, housing: $1.28 trillion
Private credit card debt and personal borrowings $140 billion
Private company borrowings from banks, etc about $730 billion
So, other borrowings: .87 trillion
Total Australian Debt $3.37 trillion,
roughly, in May 2013
according to an article (no longer available) at www.news.com.au /national /quality-over-quantity-matters-in-debt/story
So who is in the black?
| Various Australian Managed Funds (excluding "cross-investments") — superannuation (about 75% of the total), public unit trusts&life insurance (about 25% of the total) ABS Link $2.3 trillion in 2014 $3.8 trillion in 2023 | $2.3 trillion |
| Gross: Overseas investors (in Australia residents)
DFAT Link $3.2 trillion in 2014 $4.6 trillion in 2023 click here for a recent AFR article | |
| less: Australian investors (in overseas resident)
DFAT Link $2.2 trillion in 2014 $3.8 trillion in 2023 | |
| Nett from Overseas Investment ABS Link: $1.0 trillion | $1.0 trillion |
| Leaving a balance, roughly, for banks and other investors in Australia to supply: | $70 billion |
| Total: | $3.37 trillion |
Yep, we've relied hugely on overseas investment since 1788 — starting with those famous IOU's written in 1793 for 7,500 bottles of overseas rum, authorized by the British Regiment's Paymaster — but with so much now available in our own superannuation and insurance and trust funds, the percentage of nett overseas investment has actually dropped.
So, while Mr Abbott and Mr Hockey are doubtless wise in endeavouring to, very gradually, reduce the $300 billion owing in federal bonds, those other figures do help to bring it all into a better perspective, with all the shouting that's going on.
Thank you Lord, yes, to rest in you, to look to you, our loving heavenly Father, for each coming day's needs.
"give us day by day, the bread for each coming day" as several translations put it.
Blessings all :-) Steve
And at the end of the day, as the scripture says, each one of us has to bear his own load, whether as individuals, company directors or politicians. Ahh the Lord knows.
** End of article